Researcher / Academic Guide
I need structured, comparable industry data I can cite and use in cross-sector analysis.
You need structured, standardised, citable data across multiple industries for cross-sector analysis. You want granular attribute-level scores and pre-applied frameworks — not high-level summaries.
Working example
Other Monetary Intermediation (Banking) ISIC 6419
You're writing a paper on the structural impact of digitalisation across financial services. You need standardised attribute scores for Banking and a technology comparator, plus pre-built PESTEL and SWOT analyses for both.
Journey 1
Build a structured cross-sector dataset
Extract comparable, standardised attribute scores from multiple industries to support quantitative cross-sector analysis.
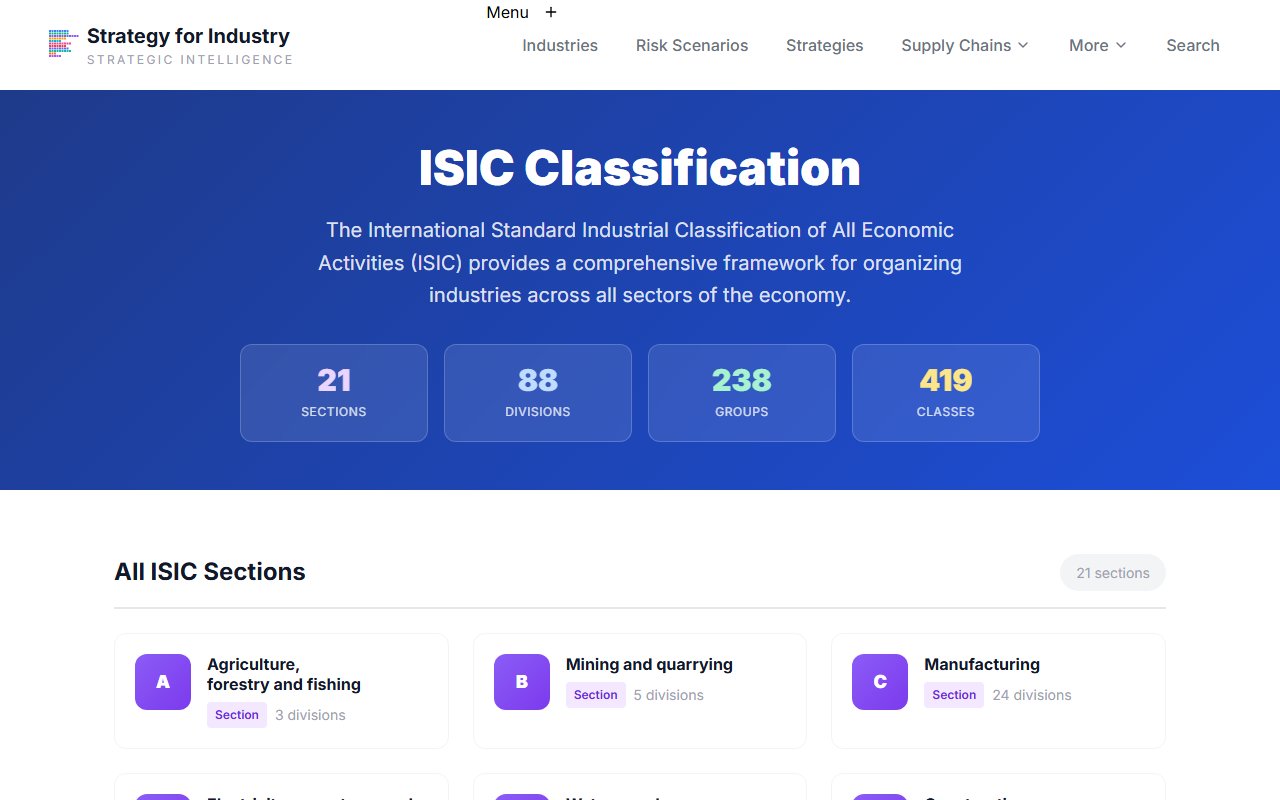
ISIC Taxonomy
Start from the ISIC taxonomy
Navigate the ISIC hierarchy to locate your research industries by official classification.
The ISIC hierarchy goes Section → Division → Group → Class. Banking sits in Section K (Financial Activities), Division 64, Group 641, Class 6419. Use this path for precise classification in your citations.
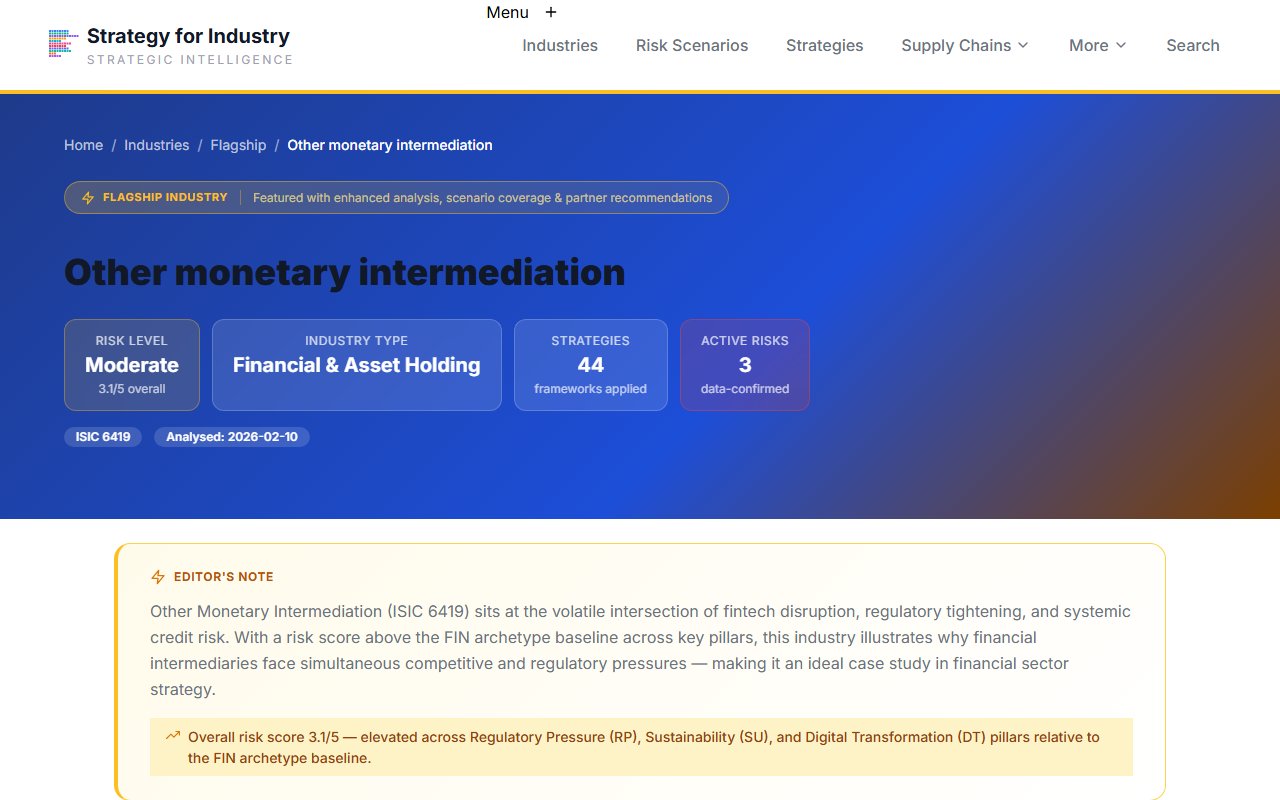
Industry Hub
Open the primary industry profile
From the ISIC page, follow the link to the full industry profile.
The industry hub gives you the executive summary, archetype classification, and all confirmed risk conditions. The attribute fingerprint visualisation shows all 83 scores at a glance.
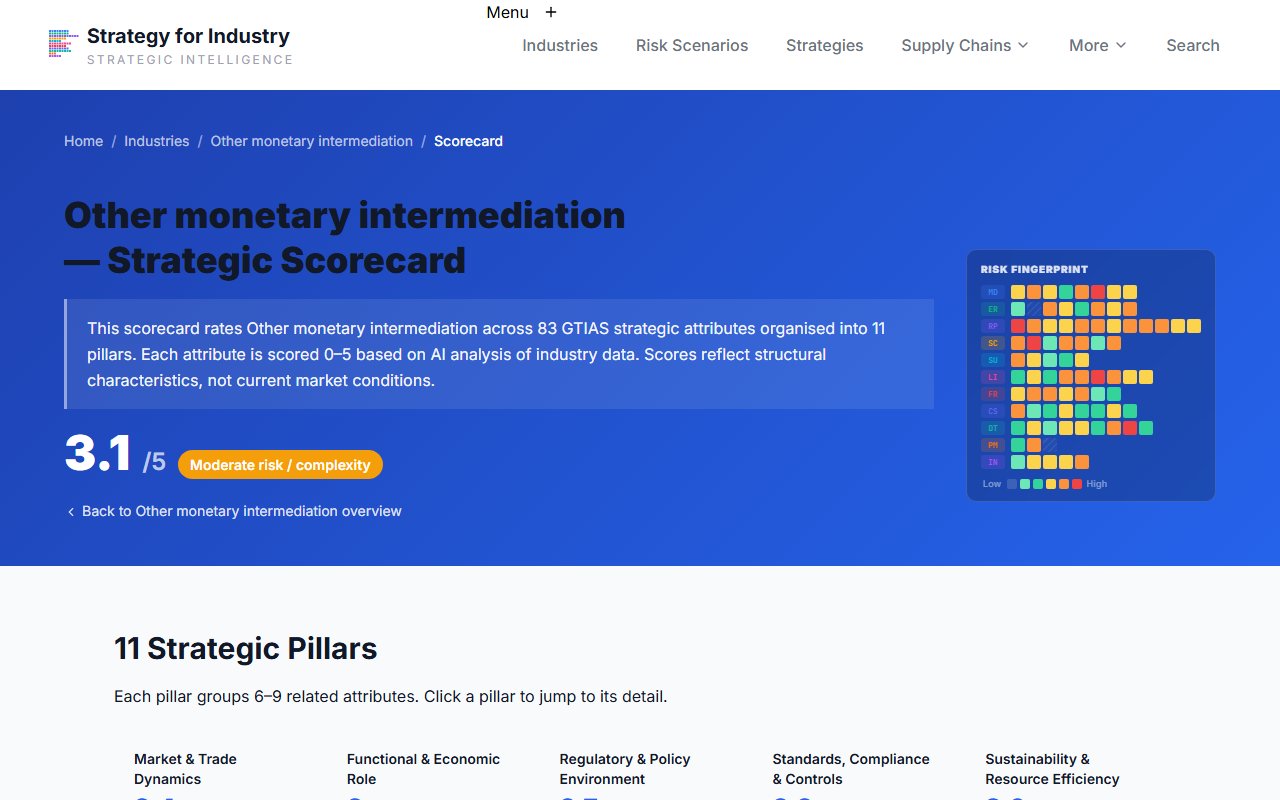
Industry Scorecard
Open the full attribute scorecard
Navigate to the Scorecard page for all 83 attribute scores with rationale text.
Scores are consistent across all industries (same 0–5 scale, same attribute definitions), making them directly comparable. For digitalisation research, focus on the DT (Digital Transformation) and IN (Innovation) pillars.
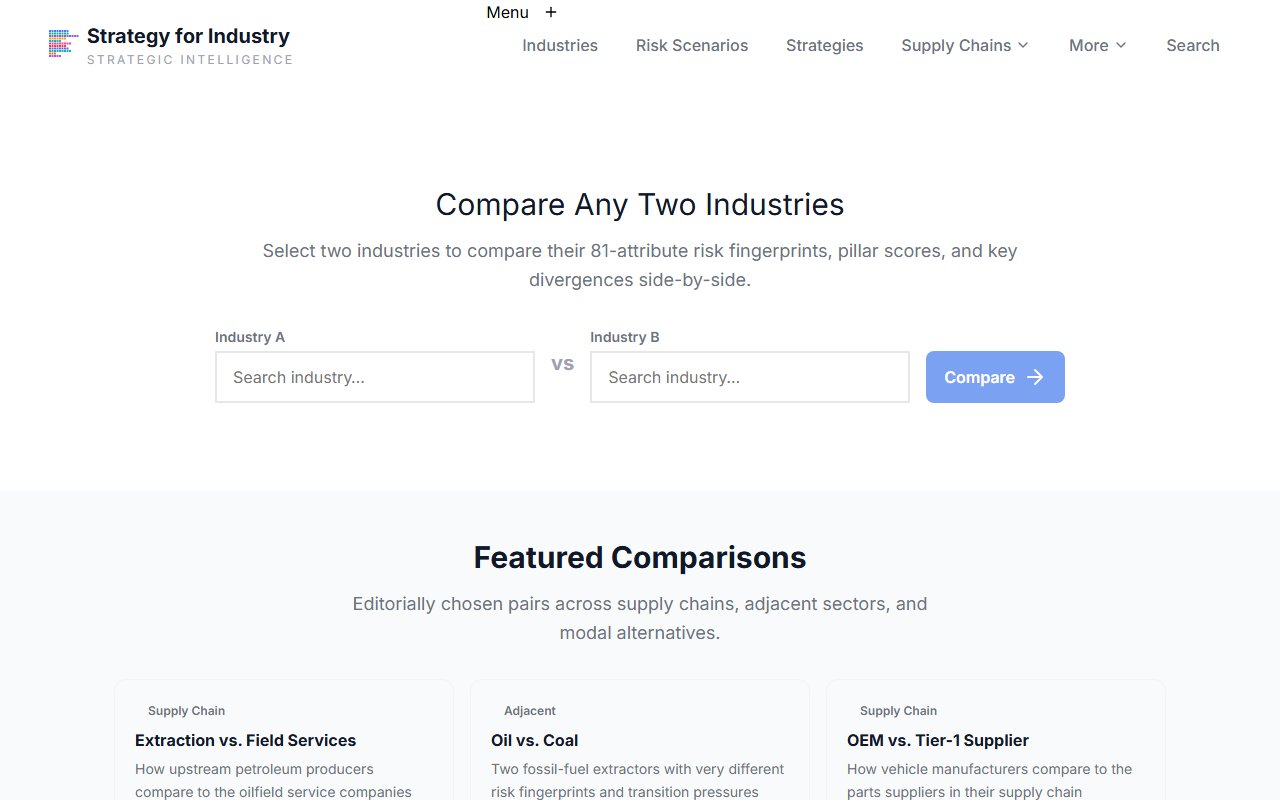
Compare Tool
Compare with a technology-sector industry
Open the Compare tool with Banking vs. Computer Programming Activities.
The compare view shows attribute-level differences for all 83 scores. You can read the divergence data as a structured dataset — each row is an attribute with codes, pillar, scores for both industries, and delta. Directly usable for quantitative analysis.
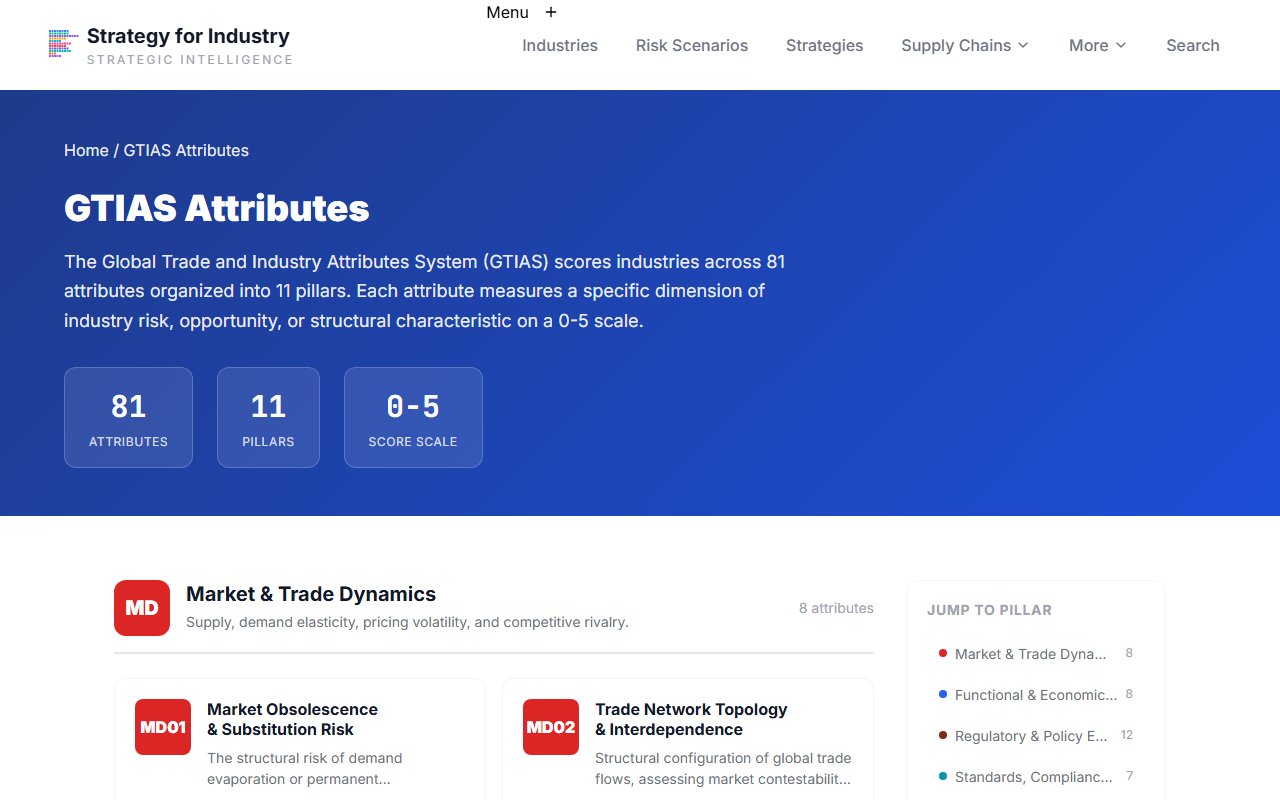
Attributes Index
Check attribute definitions for citation
Open the Attributes index to find precise definitions and scale descriptions for each attribute.
Each attribute page shows the full scale definition (0–5) with what each level means in practice. These are the operationalisation definitions you need for the methods section of your paper.
After this journey
You have: standardised attribute scores for two industries across 83 dimensions, attribute definitions for citation, and a comparative divergence dataset — all structured around the GTIAS framework and linked to ISIC classifications.
Journey 2
Access pre-built strategy framework analyses for your research industries
Use pre-applied SWOT and PESTEL analyses as structured inputs for framework-based research, avoiding weeks of manual application to each industry.
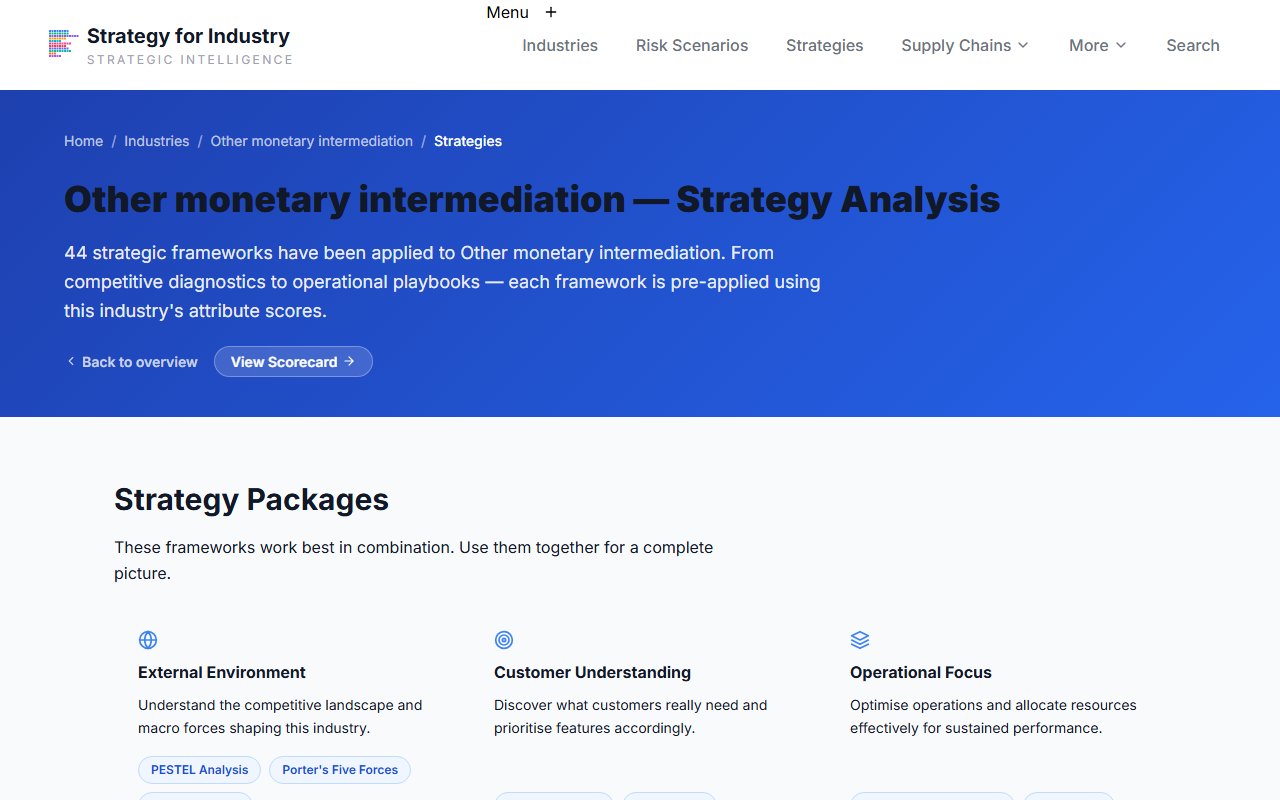
Strategies Overview
Open the strategies overview for your primary industry
Navigate to the Strategies Overview for Banking.
The overview shows all 42+ strategy frameworks available, with frameworks that have structured outputs highlighted. SWOT, Porter's 5 Forces, PESTEL, and Jobs-to-be-Done all have structured attribute-referenced outputs for this industry.
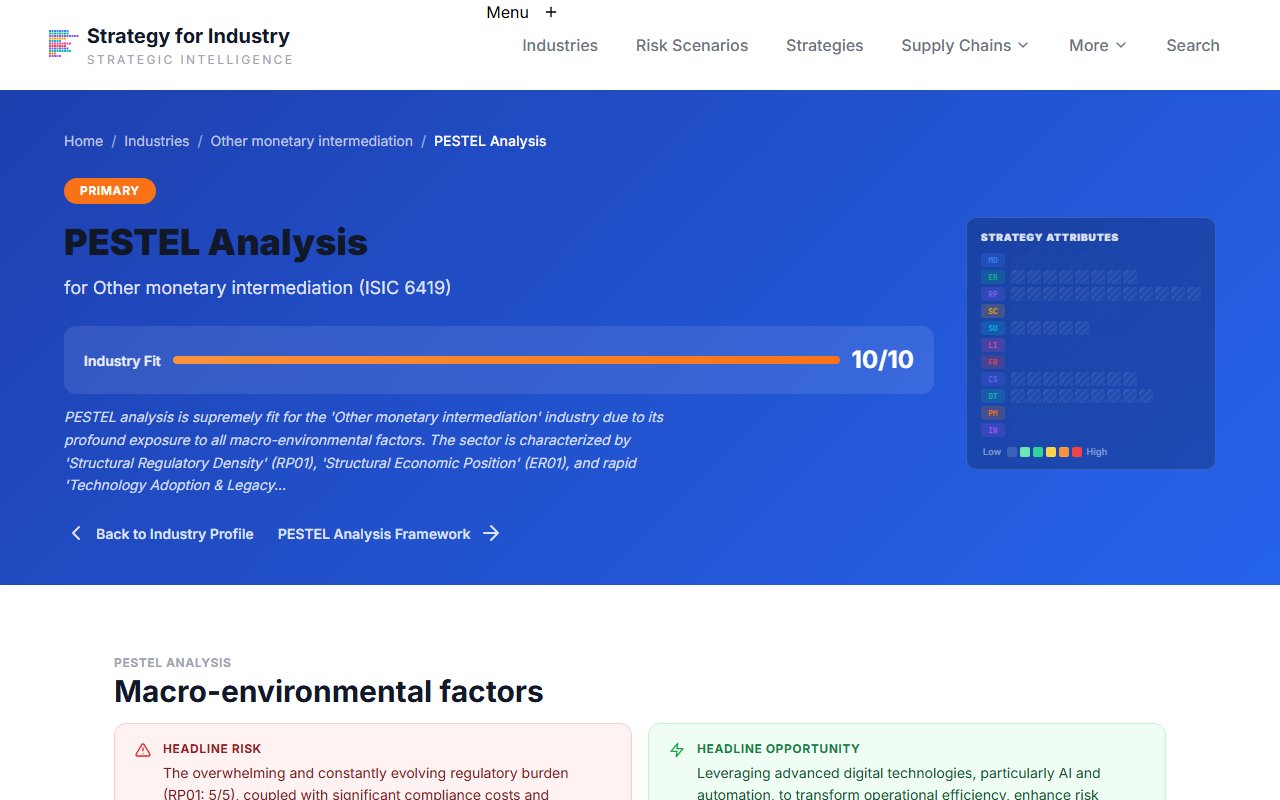
PESTEL Analysis
Read the PESTEL analysis
Open the PESTEL framework page for the banking industry.
Each PESTEL factor includes a significance rating (1–5) and attribute references (e.g., 'RP03 score indicates high regulatory burden'). Attribute cross-references make PESTEL findings traceable back to specific GTIAS scores — useful for methods transparency.
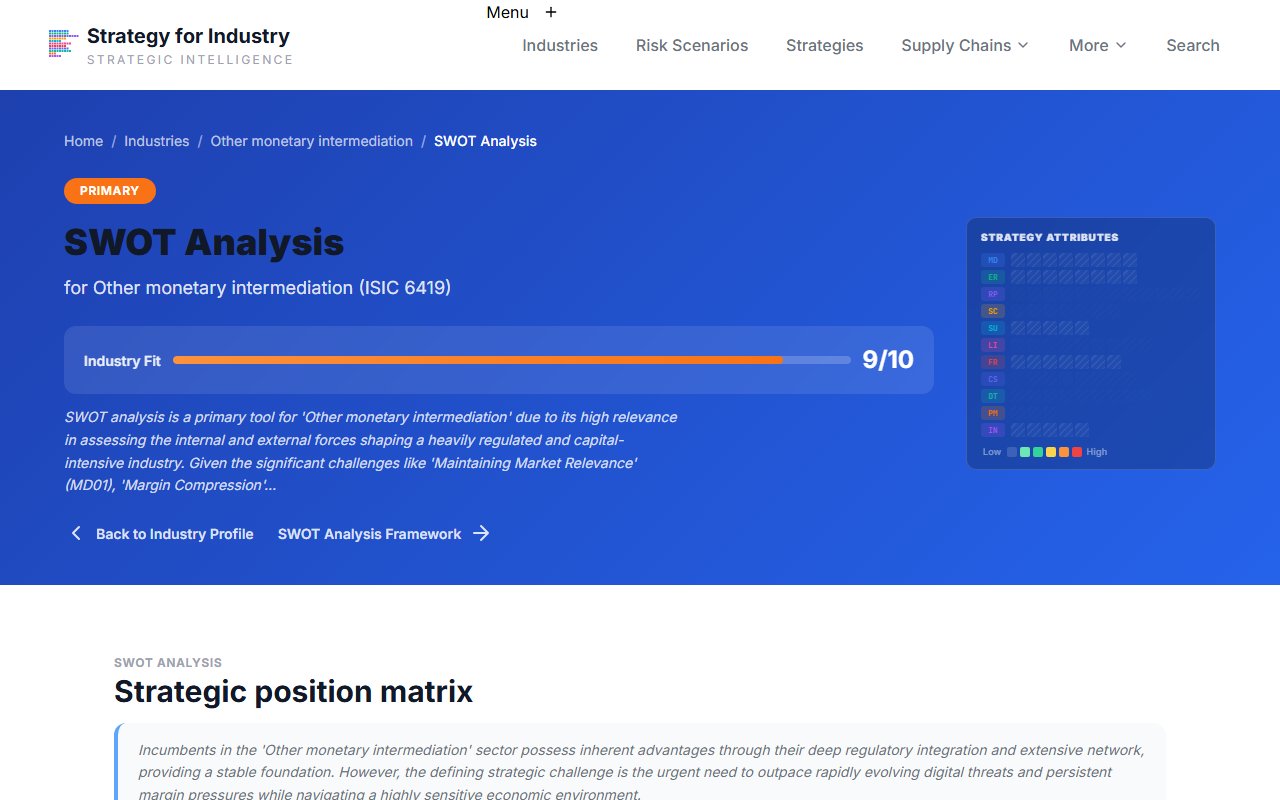
SWOT Analysis
Read the SWOT analysis
Open the SWOT framework page for the banking industry.
SWOT quadrants each contain 3–5 bullets with attribute references. These references connect qualitative SWOT findings to quantitative attribute evidence — a stronger methodological design than unsupported qualitative analysis.
Comparator Strategies Overview
Repeat for a comparator industry
Open the strategies overview for Computer Programming Activities and read the same frameworks.
Having PESTEL and SWOT for both industries, each referenced to the same GTIAS attribute codes, allows direct cross-industry framework comparison — a stronger research design than two independently derived analyses.
After this journey
You have pre-built, attribute-referenced SWOT and PESTEL analyses for two industries — structured consistently, traceable to a scored attribute framework, and ready to compare side-by-side in your paper.
Journey 3 — Explore next
Explore GTIAS archetype classifications for industry typology research
If your research involves industry typologies or structural classification, the Archetypes section classifies all 1,247+ industries into 7 structural types (BIO, IND, FLO, UTL, DIG, FIN, SVC) with baseline attribute profiles. Each industry page shows its archetype deviation — how far it sits from its structural baseline — which is a derived comparative measure ready for typological analysis.
Explore GTIAS archetypesReady to explore?
Start with the working example for this guide — or search for any industry.