Analyst / Investor Guide
I need a comparable, attribute-level view of industry risk to evaluate and benchmark investment targets.
You evaluate investment opportunities across sectors and need a structured, comparable view of industry risk — one that lets you benchmark, find analogues, and identify structural vulnerabilities before making a recommendation.
Working example
Banking vs. Computer Programming ISIC 6419
You're evaluating a fintech platform (ISIC 6201) that positions itself as a disruptor to traditional banking (ISIC 6419). You need to understand the structural risk divergence between both industries before writing your investment note.
Journey 1
Structural comparison of a disruptor vs. its incumbent sector
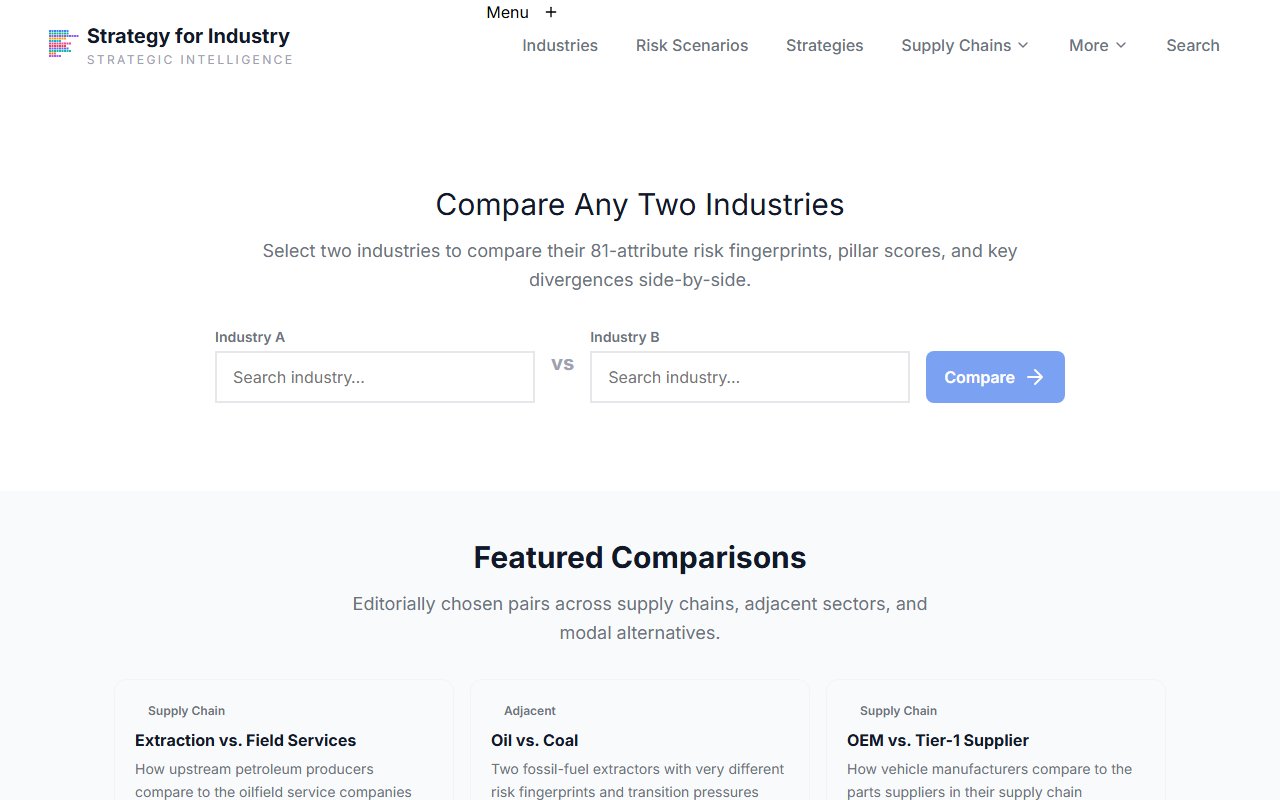
Compare the 83-attribute risk fingerprint of a technology company vs. its target financial sector to identify structural advantages, vulnerabilities, and key risk divergences.
Compare Tool
Open the Compare tool
Go to the Compare tool and set up Computer Programming vs. Banking.
Select 'Computer Programming Activities' (6201) as Industry A and 'Other Monetary Intermediation (Banking)' (6419) as Industry B. The comparison will show all 83 attribute scores for both, with divergence highlighting.

Compare Results
Read the key attribute divergences
On the results page, identify the attributes with the largest score gaps.
Focus on three pillar groups: Digital Transformation (DT) — the fintech advantage; Financial Risk (FR) — the regulatory cost of banking; Regulatory Pressure (RP) — the incumbent's moat. Large DT advantage combined with high FR and RP in banking tells you exactly why the disruption thesis holds.
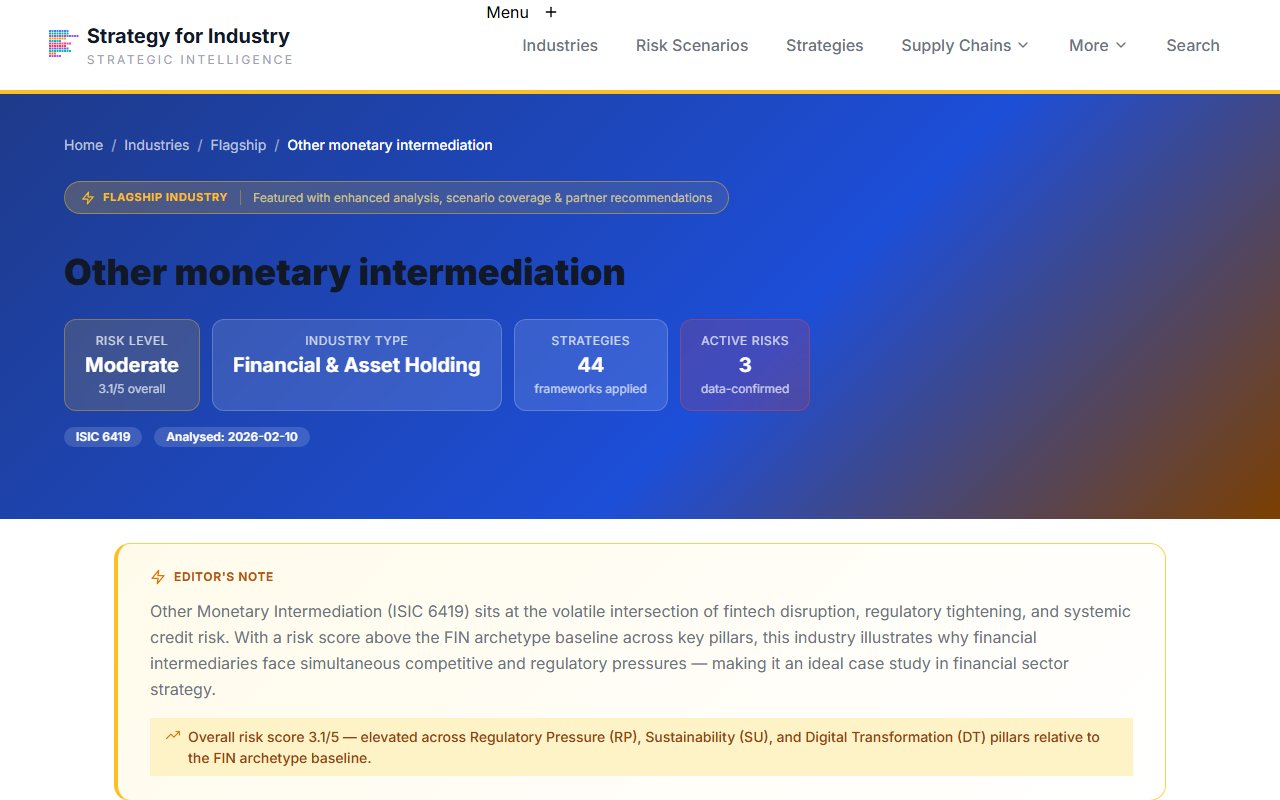
Banking Industry Hub
Check confirmed risk scenarios for each industry
Open each industry's hub page and review confirmed active risks.
Confirmed risks for banking are likely in FIN-SOL (solvency/liquidity), DIG-SEC (cybersecurity), and GEO-SOV (regulatory/sovereignty) domains. These are the incumbent's liabilities — which your disruptor can avoid, or inherit if it scales into the same regulatory perimeter.
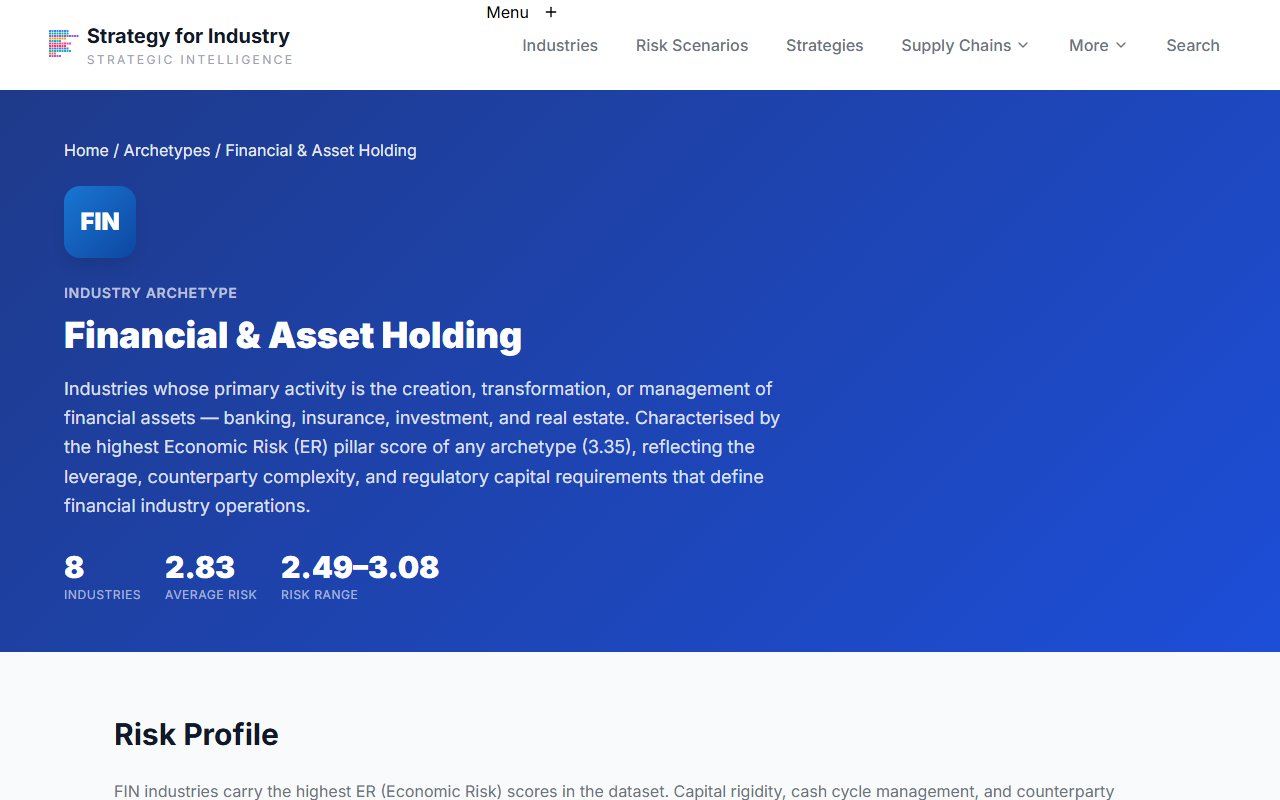
FIN Archetype
Check archetype baselines for structural context
Open the FIN and DIG archetype pages to see whether each industry's scores are typical for its structural type.
An industry that scores anomalously low-risk for its archetype is potentially more resilient than peers. An industry that's high-risk within its archetype is a concentration risk. Use archetype deviation to contextualise whether the risk you see is idiosyncratic or structural.
After this journey
A structured investment thesis: attribute-level risk fingerprint for both industries, confirmed risk conditions for each, archetype baseline benchmarks, and a clear picture of where the disruptor's structural advantages are most defensible.
Journey 2
Assess downside risk and cascade exposure for a target industry
Build a downside scenario model by understanding confirmed risk conditions, cascade risk chains, and macro trend amplifiers for a specific investment target.
Industry Hub
Open the industry hub and review all risk sections
Open the banking industry hub and scroll to both 'Confirmed Active Risks' and 'Also on the Radar'.
'Confirmed Active Risks' are score-triggered. 'Also on the Radar' shows partially matched scenarios — watch conditions that could tip into confirmed status with a macro shock. This is your early warning set.

Matched Scenario
Open a high-impact matched scenario
Click through to a matched scenario to read the full risk detail.
Focus on the 'Cascade Risks' section — this shows which other risk rules would trigger if the primary condition is unmitigated. A long cascade chain means a single trigger can become a multi-domain risk event. This is your stress-test scenario input.

Industry Hub — Archetype Context
Review the archetype deviation for anomaly detection
On the banking industry page, read the Archetype Context block.
If the industry scores anomalously high on any risk attributes compared to the FIN baseline, those deviations are idiosyncratic risks — not shared across the archetype. These are industry-specific catalysts that generic sector analysis misses.

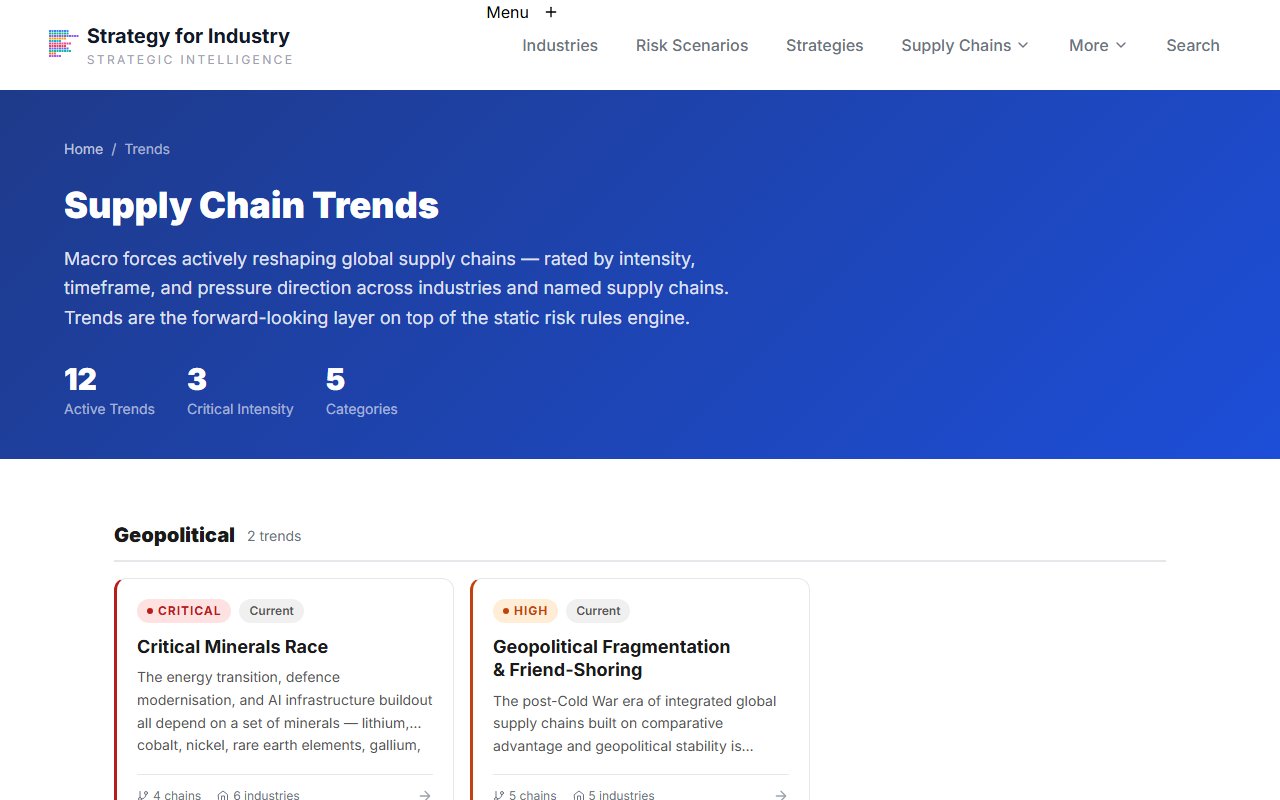
Macro Trends
Read macro trends affecting this industry
Scroll to the Trends section on the industry page, or navigate to Macro Trends directly.
Trends show which global forces are amplifying existing risk conditions. For banking, 'geopolitical fragmentation' and 'ESG supply chain due diligence' are headwinds. 'AI and machine learning' could be a tailwind (efficiency) or headwind (disruption) depending on your thesis.
After this journey
A structured downside risk brief: confirmed conditions with trigger evidence, cascade risk chains for stress-testing, archetype-idiosyncratic risk flags, and macro trend amplifiers — ready for the risk section of your investment note.
Journey 3 — Explore next
Find industries with similar risk profiles for proxy comparisons
On any industry hub page, scroll to the 'Similar Industries' section to see industries ranked by attribute fingerprint similarity. Industries at the top of that list share structural risk characteristics — not just sector category. Use the Compare tool to validate that the similarity is relevant to your investment thesis before using them as proxy comparators.
Find banking's structural peer groupReady to explore?
Start with the working example for this guide — or search for any industry.