Fund Manager Guide
I need to understand systematic risk at the archetype level before drilling into individual industries.
You think in archetypes and allocate capital at the sector level before picking individual industries. You need systematic risk views — which archetype is over-exposed to current macro conditions, and which industries are outliers within that archetype.
Working example
Utilities Archetype (UTL) ISIC 3510
You're considering rotating capital into defensive utility sectors given current macro conditions. Before picking specific industries, you need to understand the UTL archetype's systematic risk profile, which member industries deviate most from the baseline, and how utilities compare structurally to the industrial sectors you're rotating out of.
Journey 1
Understand an archetype before picking individual industries
Get the systematic risk baseline for the Utilities archetype, identify which attributes are structurally elevated, and find which member industries are outliers from that baseline.
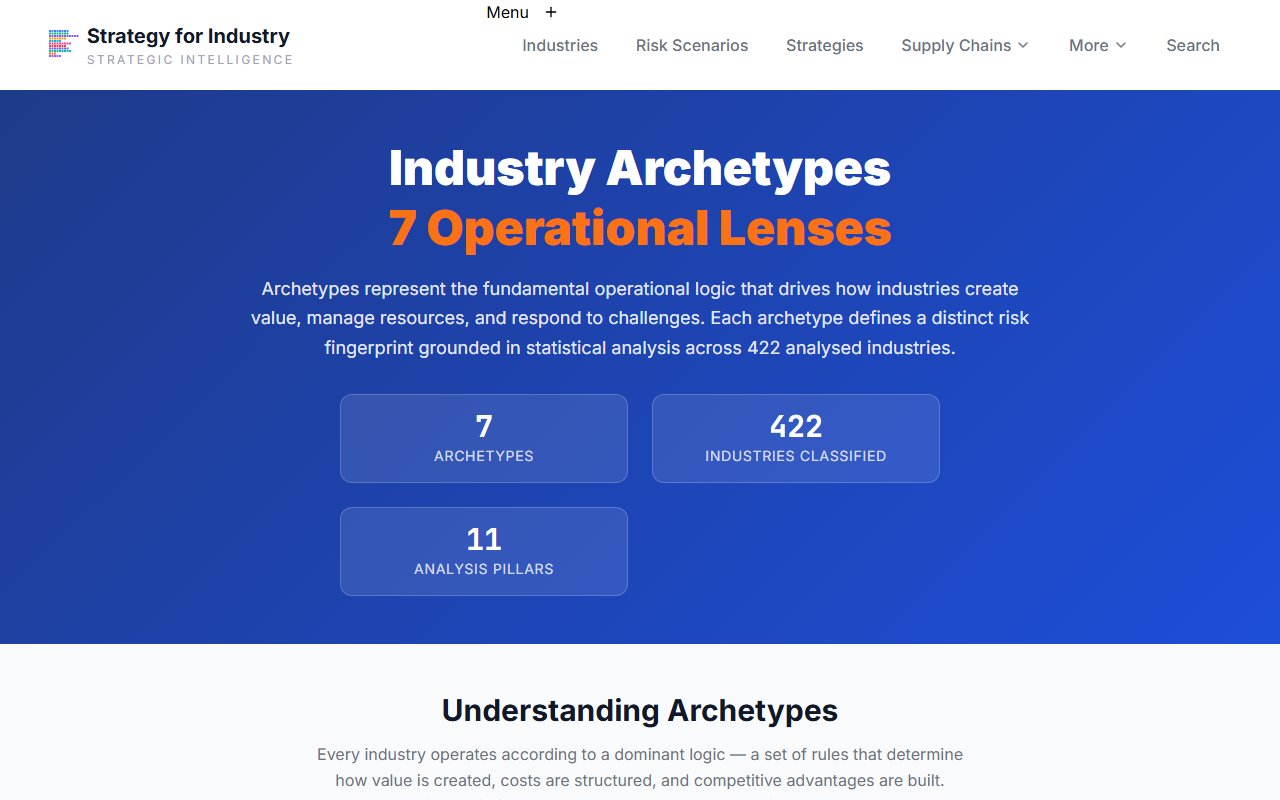
Archetypes Index
Go to the Archetypes index
Open the Archetypes page to review all 7 GTIAS archetype types.
The 7 archetypes are BIO, IND, FLO, UTL, DIG, FIN, SVC. Each has a defining attribute baseline. The Utilities (UTL) archetype is defined by capital intensity, regulatory dependency, and relatively low digital maturity compared to DIG or FIN types.
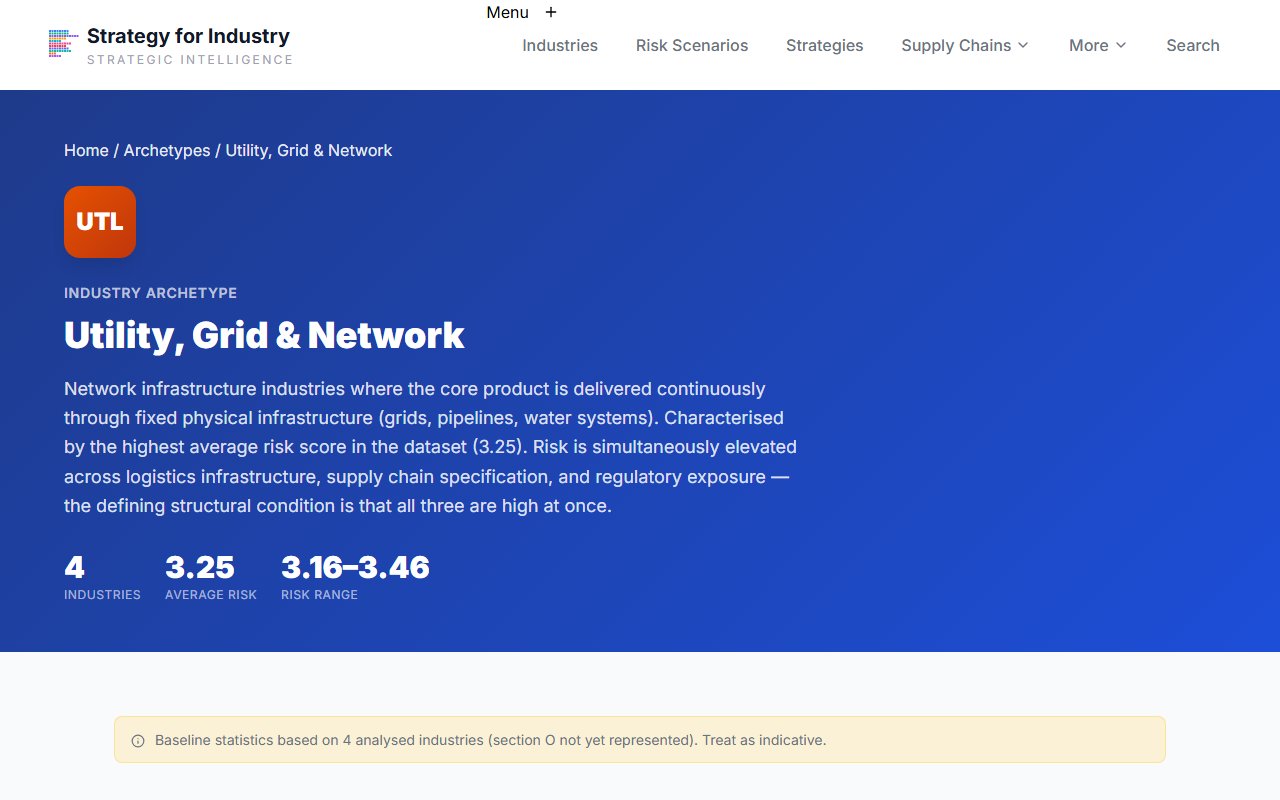
UTL Archetype
Open the UTL archetype profile
Click into the Utilities archetype for the full baseline profile.
The archetype profile shows: defining characteristics, pillar importance scores (which pillars matter most for this archetype), the baseline attribute profile, and the full list of member industries. High-importance pillars in UTL are typically ER (Economic Risk), RP (Regulatory Pressure), and FR (Financial Risk).
UTL Archetype — Member Industries
Review member industries ranked by risk deviation
On the archetype page, review which member industries deviate most from the UTL baseline.
Industries with the highest positive deviation from the UTL baseline are anomalously high-risk for their structural type — potential concentration risks. Industries with negative deviation are more resilient than the archetype average — potential defensive positions.

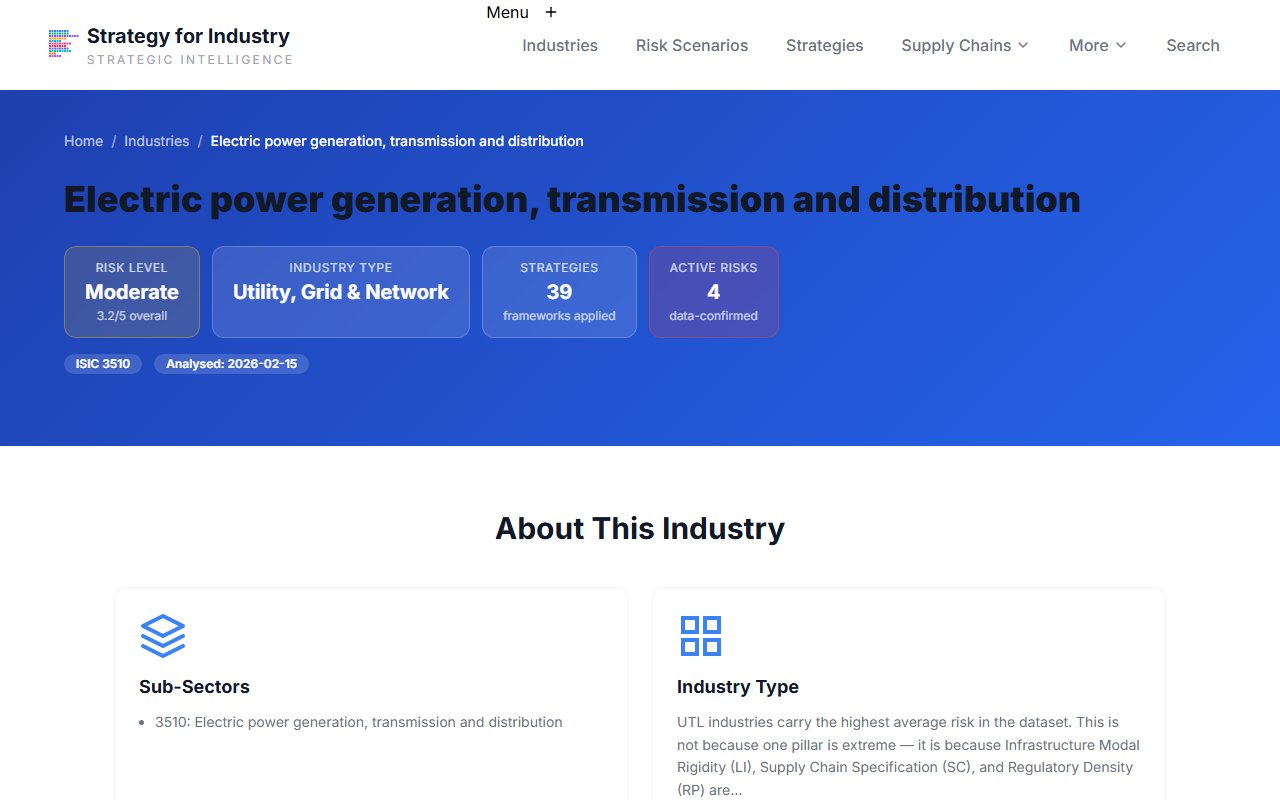
Industry Hub — Archetype Context
Drill into a specific industry to understand its deviation
Click into an outlier industry from the archetype page.
On any industry page, the 'Archetype Context' block explains exactly which attributes drive the deviation from the archetype baseline. A high RP deviation in a UTL industry means above-average regulatory pressure for its structural type — read the specific attributes before any allocation decision.
After this journey
You have: the UTL archetype systematic risk profile, a ranked list of member industries by deviation from baseline, and 2–3 outlier industries with explained attribute-level divergence — the foundation for an archetype-level allocation thesis.
Journey 2
Cross-archetype structural comparison for sector rotation
Compare industries from your outgoing and incoming archetypes to understand the structural risk divergence beyond just score differences — confirming the rotation thesis with attribute-level evidence.
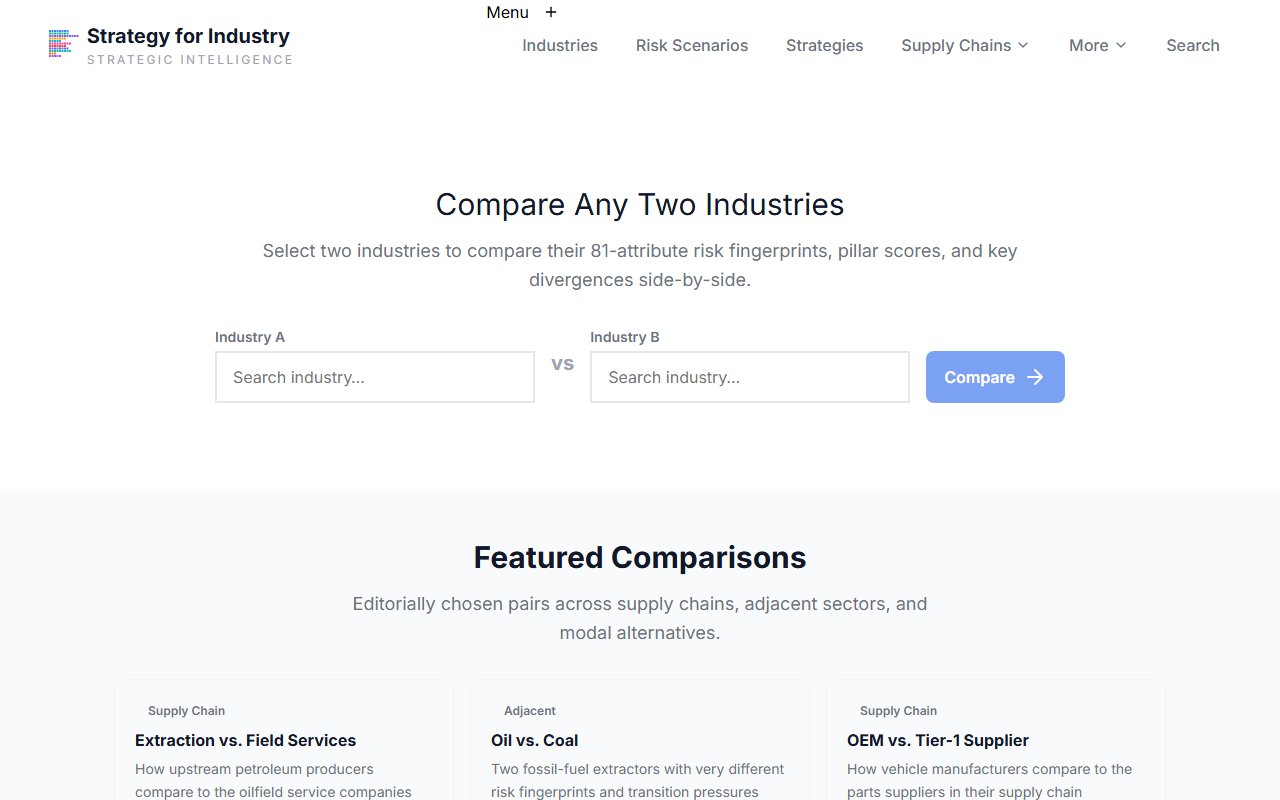
Compare Tool
Open the Compare tool
Go to the Compare tool and select one industry from each archetype.
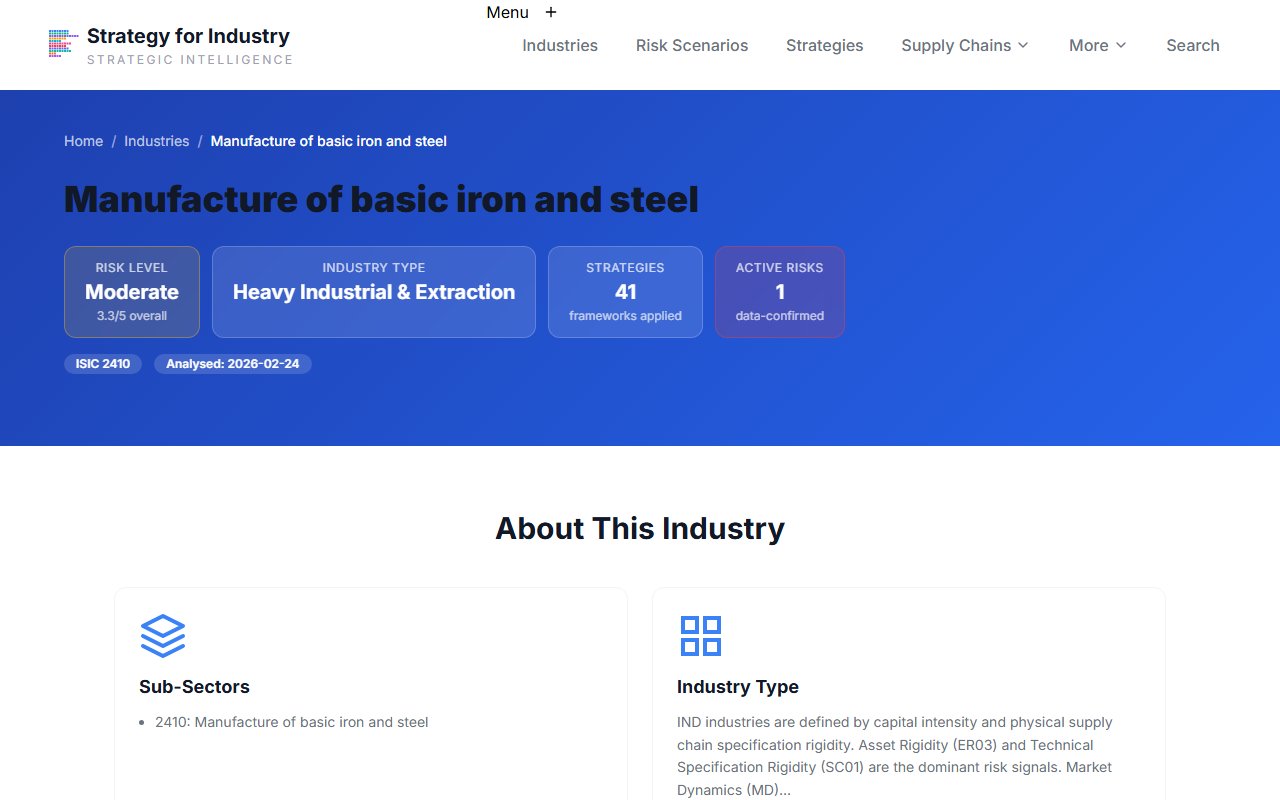
Select 'Manufacture of Basic Iron and Steel' (IND archetype, ISIC 2410) as Industry A and 'Electric Power Generation' (UTL archetype, ISIC 3510) as Industry B. This creates an IND→UTL rotation comparison — exactly the structural shift you're evaluating.

Compare Results
Focus on macro-sensitive pillar divergences
On the results page, look at the Financial Risk (FR), Economic Risk (ER), and Sustainability (SU) attribute groups.
These three pillar groups are most sensitive to macro conditions: interest rate cycles (FR/ER), ESG mandates (SU), and geopolitical fragmentation (ER/SC). The attribute-level divergence tells you which macro risks transfer across archetypes and which are type-specific.
IND Industry Hub
Check archetype deviation for each industry
Open each industry's hub page and read the Archetype Context block.
Before rotating, confirm the IND industry you're exiting is typical for its archetype (not an anomalously resilient outlier you'd be selling at a discount) and the UTL industry you're entering is not anomalously high-risk relative to the UTL baseline.
Trend Impact Matrix
Review the macro trends impact matrix
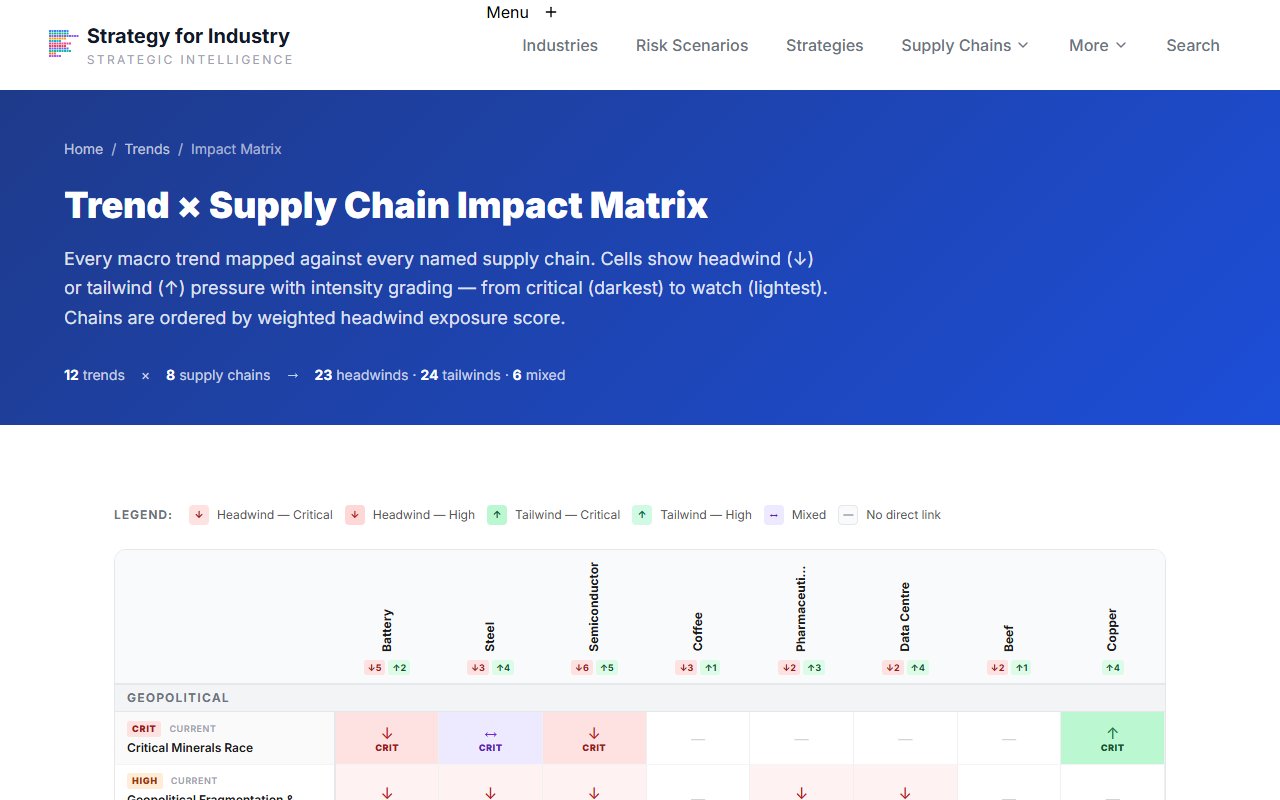
Go to the Trends Impact Matrix to see which supply chains and sectors face the most macro headwinds.
The impact matrix shows a grid of supply chains vs. macro trends with headwind/tailwind direction. Supply chains map closely to IND and UTL archetype exposure — use it to confirm your rotation thesis has macro tailwinds, not headwinds.
After this journey
A validated rotation thesis: attribute-level structural divergence between outgoing and incoming archetypes, archetype deviation confirmation for the specific industries you're trading, and macro trend headwind/tailwind signals — ready for an investment committee presentation.
Journey 3 — Explore next
Track ESG-related systematic risk exposure across archetypes
Use the ESG domain pages and the matched scenario data per industry to identify which archetypes carry the most ESG-related regulatory exposure — relevant as ESG mandates widen globally. Start at the Risk Domains page, open the ESG-ENV domain, and cross-reference affected industries with their archetype classifications to build an archetype-level ESG heat map.
Open ESG risk domainReady to explore?
Start with the working example for this guide — or search for any industry.